Zemax OpticStudio software allows the evaluation of the performance of any optical system using different metrics, including the analysis of the spot diagram, the
aberrations present at each surface of the system, and the impulse response and its reciprocal Fourier transform. All these analyses are available on the Analyze tab
of the software. Without any loss of generality, we have evaluated the performance of the proposed confocal microscope by analyzing the aberrations through the Seidel, the system’s frequency response through the Modulation Transfer Function (MTF), and the variation of the spot size.
First, let us start with the Seidel diagram, which provides information about the aberrations up to the third order. In other words, Zemax OpticStudio informs us
about the following aberrations: spherical aberration, coma, astigmatism, field curvature, distortion, axial color, and lateral color. A more detailed information of
these optical aberrations can be found in (Dereniak, 2008). Based on the Seidel diagram, we found that spherical and axial color aberrations were the only ones
present in the system. Spherical aberration is present when the outer parts of an optical element do not focus the light rays at the same axial plane, generating a
blurred image. On the other hand, axial color aberration is a type of chromatic aberration caused by the fact that light rays focus on different axial planes based
on wavelength/color. In other words, if the material of the optical element presents normal dispersion, blue light always focuses on planes before red light.
The aspheric condenser lens introduced these aberrations. However, since the light passes through the condenser lens twice (e.g., forward in the illumination
system and reverse in the detection system), these aberrations cancel each other, not affecting the final performance of the confocal microscope (e.g., at the
image plane there are not aberrations distorting the confocal system).
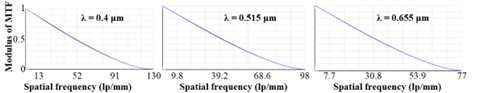
[Fig.3. System’s MTF for different wavelengths.]
The second metric used to analyze the performance of the confocal microscope was the MTF plot. This curve informs us how the information is transferred through
the imaging system. In particular, we can find which and how much the spatial frequencies are distorted by the system. In other words, the MTF plot provides a
quantitative measurement of the image contrast versus the spatial frequency. A key feature of Zemax OpticStudio software is that we can plot the system’s MTF
and compare it with the theoretical limit (known as the diffraction limit), providing us with another way to visualize if our system is distorted by aberrations.
Although we cannot identify the type of aberrations by observing the MTF plot, as a general rule, the lower the area under the curve of the MTF plot, the higher
the number of aberrations. Figure 3 shows the MTF plot of the confocal microscope for different wavelength (blue curve in Fig. 3) and its comparison with the
diffraction limit (black curve in Fig. 3). As we can see, both blue and black curves overlap for the different wavelength, meaning that the system does not present
any aberration. Observing Fig. 3, we have estimated the maximum spatial frequency passing through the confocal microscope. This maximum spatial frequency is known
as the cutoff frequency, the first frequency at which the MTF value is null. The cutoff frequency of the confocal microscope is wavelength dependent, being
130 lp/mm for violet color (λ = 0.4 μm), 98 lp/mm for green color (λ = 0.515 μm), and 77 lp/mm for deep red color (λ = 0.655 μm). The higher the value of the
cutoff frequency, the higher the resolution of the confocal microscope, being able to discriminate finer details. This behavior is already known in Optics;
the same optical instrument has a better resolution capability using purple-blue color light than red.
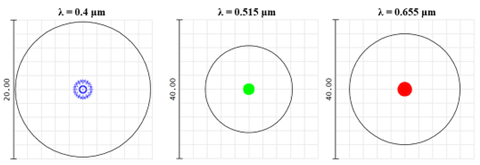
[Fig.4. Performance of the confocal microscope by comparing the spot size at different wavelengths]
Finally, we have evaluated the spot diagram of our confocal system, see Fig. 4. The spot diagram shows the image produced by our confocal system assuming that
the object was a point source (e.g., the spot of light). Aberrations such as astigmatism and coma are instantly viewed on the spot diagram since they produce
asymmetric images. Figure 4 shows that the spot diagrams for the different wavelengths are symmetrical, confirming that astigmatism and coma aberrations
are not present. This result already agrees with the conclusion provided by the Seidel diagram. From Fig. 4, we can see that the spot size is wavelength dependent.
The root-mean-square (RMS) radius is: 1.015 μm for purple color (λ = 0.400 µm), 1.138 µm for green color (λ = 0.515 µm), and 1.339 µm for deep red color
(λ = 0.655 µm). Note that there is a variation of 0.329 μm within the visible spectrum.
Conclusions
We have implemented a confocal microscope using off-of-shelf optical components and evaluated its optical performance in terms of the aberrations, the spot
size, and the MTF plot. Because confocal microscopes are typically used for multicolor imaging, it is important to ensure that the design is invariant to different
wavelengths within the visible range. To simplify the design of the microscope, we replaced the dichroic mirror with a beam splitter. Note that another alternative
exists to build a confocal microscope for inexperienced users of Zemax OpticStudio. This alternative is the design of a confocal microscope following an inline
configuration. In other words, no dichroic mirror and beam splitter are considered, and we insert all the elements in a sequence. If one follows this configuration,
the microscope objective lens must be insserted twice and in reverse order since the light passes through it twice. In the proposed confocal microscope,
we have also replaced the microscope objective lens with an aspheric condenser lens. The latest change would reduce the cost of the experimental system since the
cost of the proposed aspheric condenser lens is $32.61 versus $1,2667 for a Nikon microscope objective lens with the similar NA (N20X-PF, Thorlabs). The results
shown here demonstrate the effectiveness of our design in comparison with the theoretical expectation. We have also shown that the proposed confocal microscope
is quite robust to the change of the wavelength, showing a slight variation of 0.329 μm in the spot size from 400 nm to 655 nm. The small variation ensures the
use of the same pinhole size for multicolor imaging without affecting the performance of the experimental confocal microscope. Future work should be focused
on a more detailed comparison of the system’s performance using an aspheric condenser lens, including experimental results since no reported system has used it.
This work allows undergraduate students interested in Optical Engineering to increase their knowledge in optical system design using the Global Academic
Program of Zemax (e.g., free license for academia). In the event of insufficient funding to implement an optical laboratory, Zemax OpticStudio also allows
undergraduate students to become familiar with different imaging systems, providing them with a hands-on tool to design and analyze optical systems.